Operational Alpha Calculator

The right Investment Management Software (IMS) can help you generate more performance. 

The right IMS helps you achieve Operational Alpha through reduced operational risk & increased returns. At Limina, we’ve been in your shoes, receiving vague Return On Investment (ROI) pitches from vendors. Hence, we measure concrete results clients achieve from our software. The first case of Operational Alpha using Limina IMS is related to reducing cash drag.

See the numbers yourself below!

Reduce cash drag and boost performance

Many of us hear that cash is king. However, holding cash is subject to devaluation when running traditional long equity, fixed income or fund-of-fund investment strategies. Hence, in our industry, the Kings of returns avoid holding cash.

If a system can help you invest just a few more basis points, your long-term AuM will materially increase. Use the calculator below to see how your AuM and bottom line can be affected by an IMS that helps you achieve a lower cash buffer.

Try the Operational Alpha ROI Calculator yourself

USD
Annual management fee increase after years

Yearly added return:%
AuM in years without Limina: M USD
AuM in years with Limina: M USD
AuM increase with Limina: M USD

Assets under Management today: B USD

Annual expected return: %

Average management fee: %

Years using Limina: years

Additional cash invested with Limina IBOR: bps (%), e.g. from % to 99.7%

Key considerations

  • Minimise cash buffer
  • Settlement days (T+1, T+2, etc)
  • Protect against overdraft
Show me how a system can help Generate Operational Alpha

What is Operational Alpha?

Operational alpha is the generation of portfolio performance from activities other than portfolio management. Securities lending, for example, allows you to earn basis points by lending out your holdings. Another example, which we discuss here, is making sure your Front Office team can invest as much of the available cash as possible – without the risk of an overdraft.

How Limina Help helps you lower your cash buffer

Limina helps asset managers reduce the cash drag by making it possible to invest more of the available cash without the risk of an overdraft.

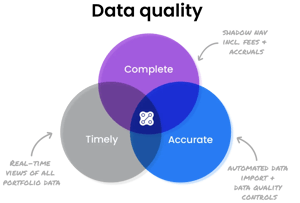
Limina doesn’t store cash balances or positions; we always calculate both from all underlying trades, accruals, deposits, etc. The result is a complete portfolio view that can, for example, include or exclude open orders, non-trading fees, etc. The system can also show exposure and cash ladders, enabling you to see your entire portfolio (positions and cash) on T+1, T+2, etc. These exposure and cash ladders strengthen asset portfolio management for multiple asset classes and scenarios:

  • Managing cashflows, including dividends, coupons, etc
  • Mutual fund settlement lags that vary between buy and sell orders
  • When T+1 settlement for US equities arrive

The Limina IMS will make assumptions on open orders, for example, at which price your open and simulated orders will execute. You can see your prospective resulting cash, even for a simulated portfolio rebalance. As actual fills come in, the cash estimates are adjusted in real time and become more certain. Should you need to, you can modify the outstanding part of orders in the market.

Data quality with explanations  light background lowres

At Limina, we know investment operations teams can contribute to portfolio performance. You can achieve operational alpha in conventional ways, such as enabling securities lending. You can also adopt equally effective, idiosyncratic methods, such as helping portfolio managers keep a lower cash buffer.

Read more of our cost and price-related articles

The total cost of ownership of an investment management system, order management system and IBOR includes both hidden and transparent parts.

Total Cost of Ownership

Many factors affect the total cost of ownership of using an investment management system. To help you calculate this, we unpack the 8 most common cost drivers of a system - out of which only one is paid to the vendor.

Cost Pressure lowres

Cost of a Portfolio Management Software

Portfolio Management Software can cost anything from $30k to millions. We explain why and what a solution that right for your needs is likely to cost

cost calculator

Limina price examples

As former investment managers we appreciate the value of transparent vendors. Explore pricing examples of our Investment Management Solution.